Sunderland 450m Results: Standard Distance Race Data and Finishing Times
Best Greyhound Betting Sites – Bet on Greyhounds in 2026
Loading...
The 450m Baseline at Sunderland
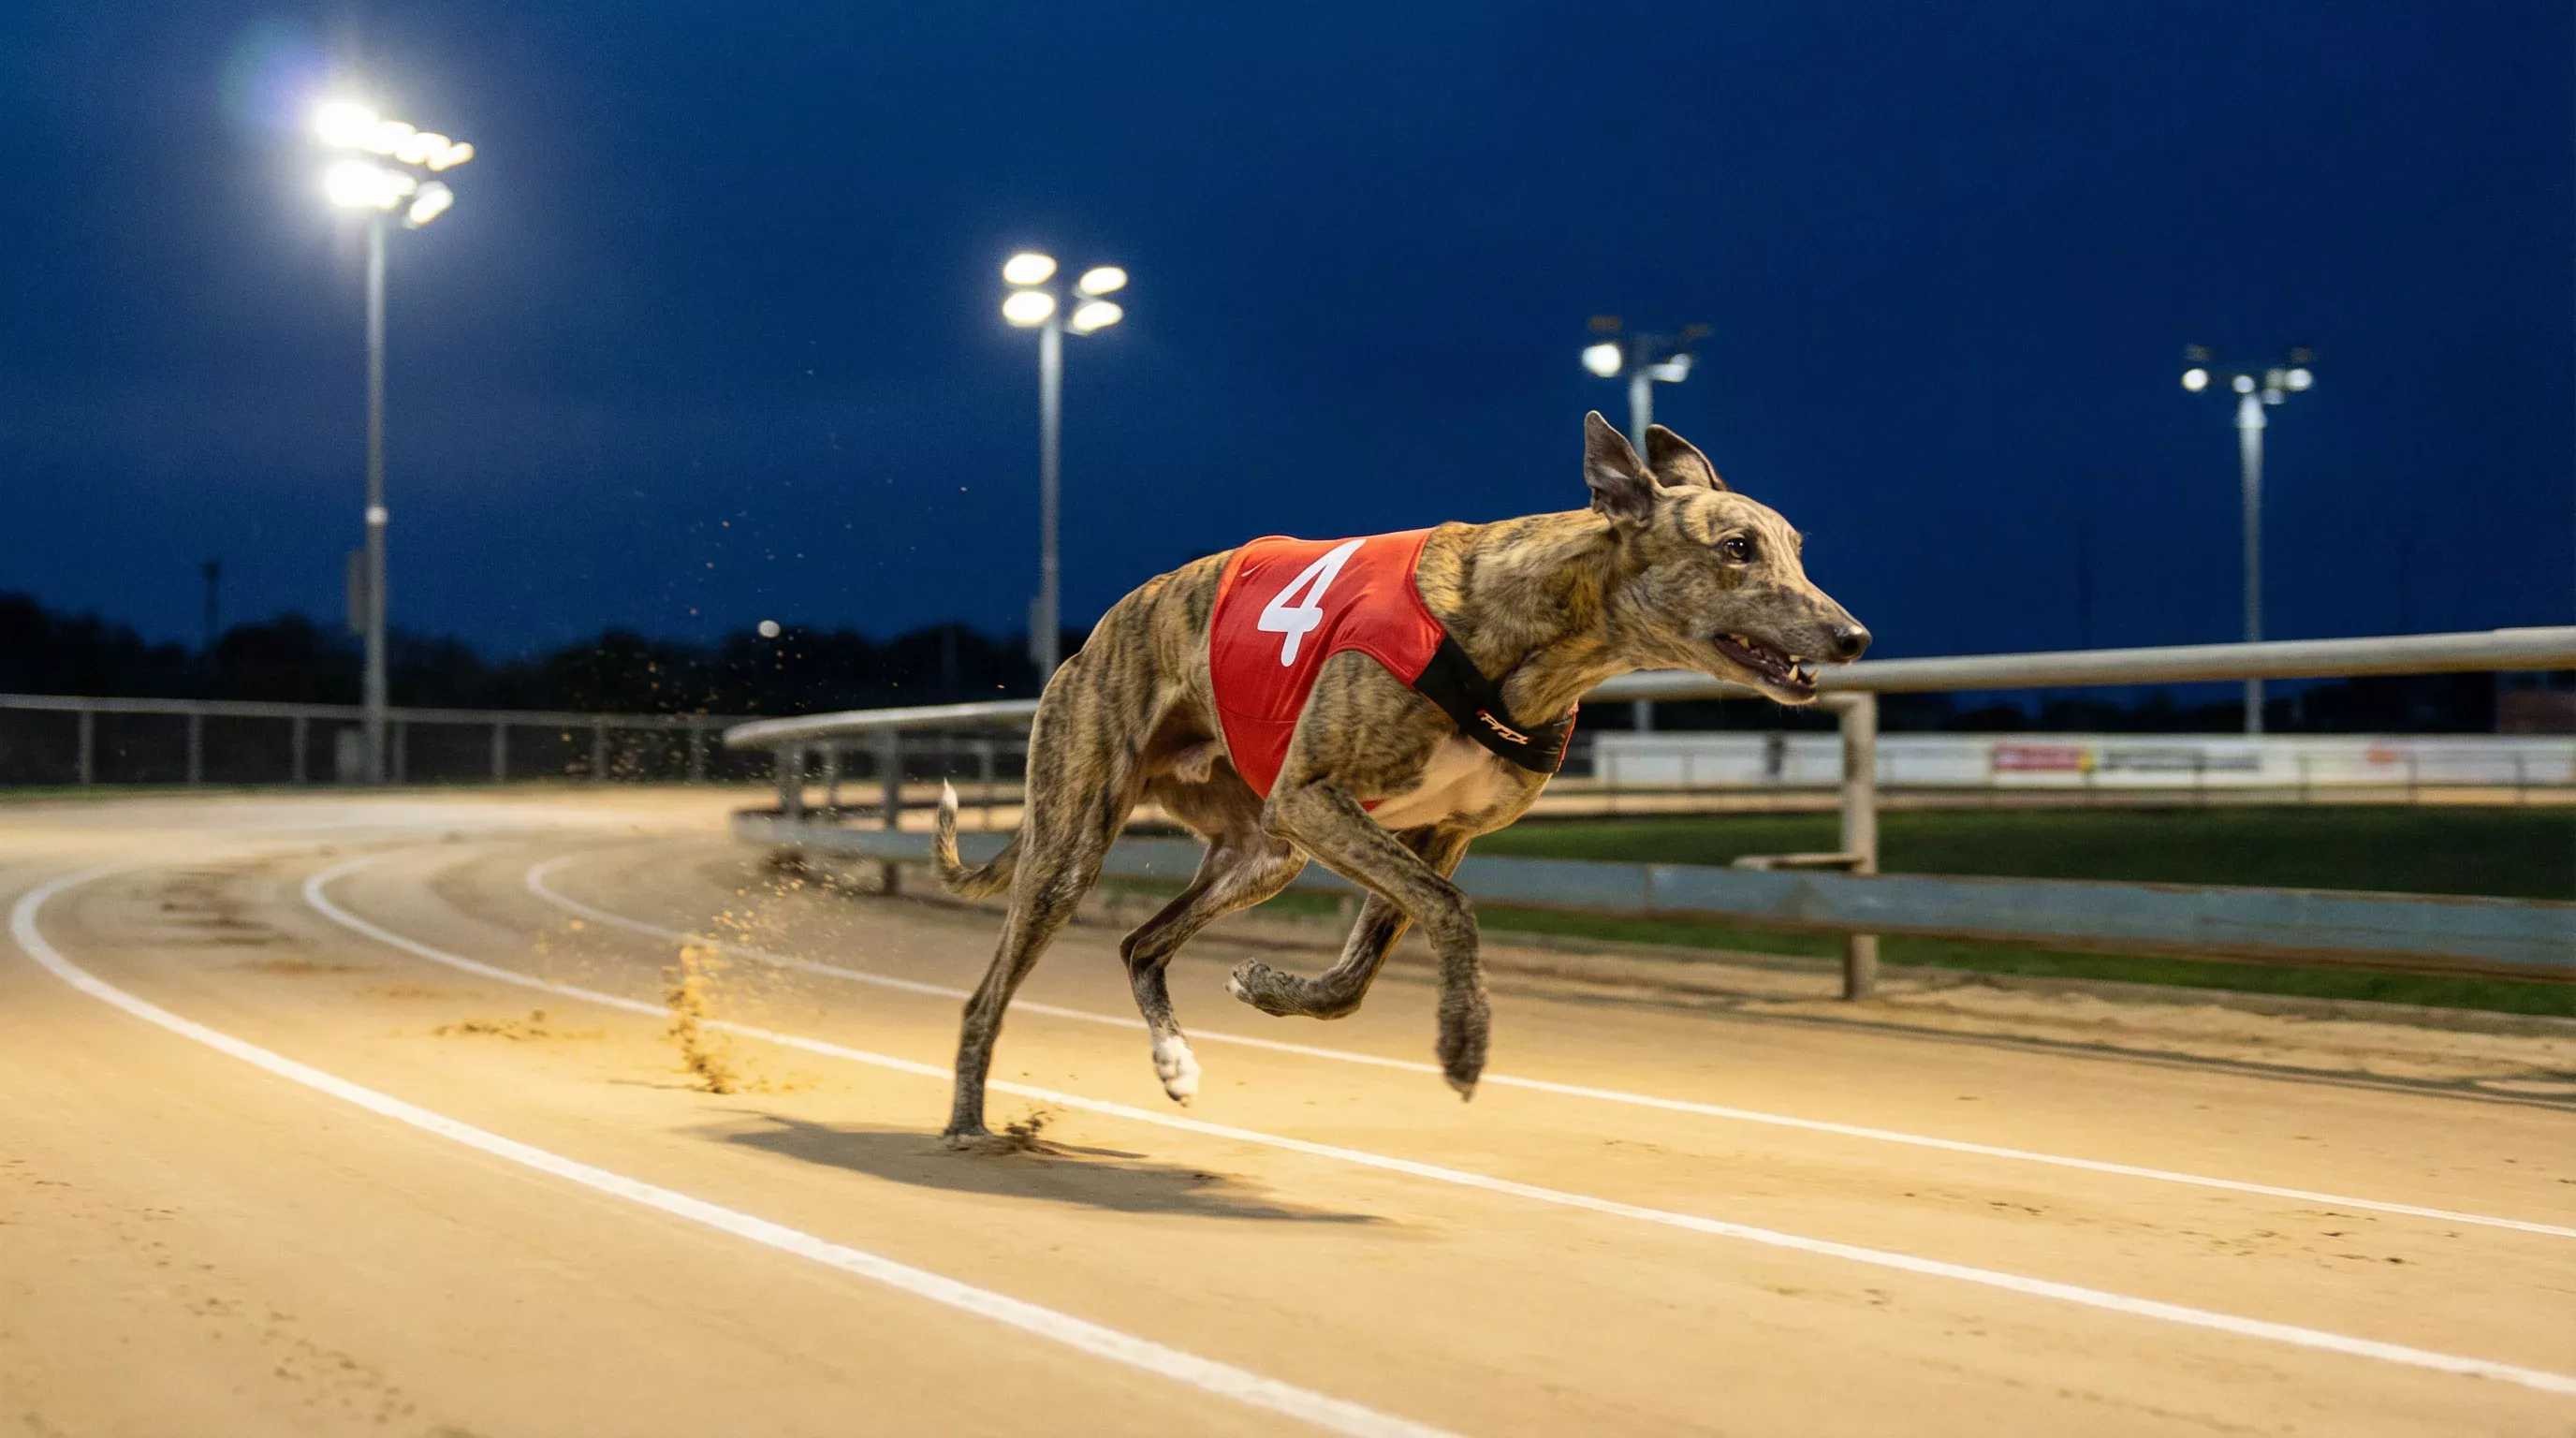
Every greyhound track has a distance that defines it. At Sunderland, that distance is 450 metres. It is the standard trip, the one that fills the majority of race cards week after week, and the one that generates the broadest pool of form data for anyone trying to make sense of the results. If you only ever study one distance at this stadium, the 450m is where to start.
The 450m is neither a sprint nor a stamina test. It sits in between, rewarding dogs that break cleanly, hold their line through two bends, and sustain pace into the home straight. That blend of demands makes it the most informative distance for comparing greyhounds across grades. A dog’s 450m time at Sunderland tells you more about its overall ability than any other single number, because the trip asks a bit of everything without pushing any single attribute to breaking point.
What follows is a breakdown of the 450m at Sunderland — how pace distributes across the race, what the sectional splits actually reveal, and how finishing times shift from one grade to another. The aim is to give you a framework for reading 450m results that goes deeper than the finishing position and the clock.
Pace Profile: Early Speed vs Late Pace at 450m
At Sunderland, the 450m race begins with a run of approximately 93 metres to the first bend. That is a generous run-up by UK standards, and it shapes the entire pace profile of the distance. Dogs have enough room to find their stride, establish position, and hit the first turn at close to full speed. Tracks with shorter runs to the first bend produce more bunching and more interference; Sunderland’s 93-metre stretch reduces that problem without eliminating it entirely.
The pace profile of a 450m race typically follows a predictable arc. Maximum speed is reached somewhere between the first bend and the back straight. By the time the field enters the third bend, most dogs have begun to decelerate — the question is how much. Early pace dogs, the ones that lead through the first two bends, tend to build margins of one to two lengths before the final turn. Whether they hold those margins depends on how efficiently they negotiate the bends and how much speed they have left for the run-in.
What makes the 450m distinct from sprints and stayers races is that the pace drop-off is moderate. At 261m, the race is over before fatigue becomes a factor. At 640m or 828m, fatigue is the defining element. The 450m sits in a zone where both early speed and late pace matter, but neither dominates. A dog that traps fast but fades at the third bend will lose to a strong closer. Equally, a dog that relies solely on late pace rarely makes up enough ground to win outright — the deficit from a slow break is too large to recover at this distance.
Sunderland’s all-weather sand surface adds a subtle layer to this. Sand is slower than hare-coursing grass and places more demand on the dog’s muscles with every stride. The deceleration curve on sand is slightly steeper than on a faster surface, which means dogs that are even marginally less fit will fade more noticeably from the third bend onward. If you are comparing 450m times between tracks, always account for Sunderland’s surface — raw times here tend to be a fraction slower than at venues running on a different composition.
For bettors studying the 450m, the pace profile translates into a practical question: does this dog lead or follow? A front-runner with a clean trap draw (especially traps 1 or 2 on the inside) often has an edge because the first bend comes early enough that the inside rail provides shelter. A closer drawn wide faces a harder task — gaining ground on the bends without being pushed wider still. At 450m, positional racing matters more than at any other Sunderland distance.
Splits Analysis: What Sectional Times Reveal at This Distance
Finishing times tell you who won and how fast. Sectional times tell you why. At Sunderland’s 450m trip, splits are recorded at intermediate points — typically the bend positions — and they expose patterns that the final clock hides completely.
The first split, covering the run to the first bend, isolates trap speed. A dog clocking a fast first section is demonstrating raw acceleration out of the boxes. This is valuable data, but it needs context. A dog that posts a quick split from trap 1, sheltered on the rail, faces less resistance than one posting the same time from trap 6 on the outside. When you compare first-bend splits, adjust mentally for the trap draw. On a track where all six traps produce roughly equal win percentages — around 17% each at Sunderland, one of the most balanced distributions in the country — trap draw alone is not destiny. But it does affect the effort a dog spends reaching the first turn.
The middle sections, from the first bend through the back straight and into the third turn, are where you see running style most clearly. A dog that holds or improves its split through this phase is sustaining pace well. A dog whose middle split drops off sharply is either tiring or losing ground through poor bend technique. Bend runners — dogs that drift wide on the turns — lose measurable time in these sections. It rarely shows up in a single length, but over two or three bends the cumulative effect is the difference between winning and finishing third.
The final section, from the last bend to the line, is a measure of finishing effort. Strong closers will post their best relative split here. Front-runners in decline will post their worst. The pattern is not always obvious because a dog comfortably in front may ease down — its final split looks poor, but the performance was dominant. This is why sectional analysis requires reading the full sequence, not cherry-picking one number.
For practical use, compare a dog’s splits at 450m across three or four recent runs. Consistency in the first split suggests reliable trapping. A deteriorating final split across races may indicate a fitness concern. And if a dog’s middle section improves when moved to a different trap, that is a strong signal that the earlier draw was costing it ground — information you would never extract from the finishing time alone. Of course, all of this data exists within a context, and at Sunderland that context is the grading system.
Grade Performance: How A, B, C, D Times Differ at 450m
Sunderland, like every GBGB-licensed track, sorts its runners into grades. The system runs from A1 at the top through to D4 at the bottom, and the purpose is straightforward: group dogs of similar ability so that races are competitive. At the 450m distance, the grading system produces a visible hierarchy of finishing times that is remarkably consistent once you know what to look for.
A-grade dogs at 450m will typically post times in the high 27-second to low 28-second range, depending on conditions. B-grade runners sit a second or so behind. C-grade dogs add another step, and D-grade races — the entry level — can produce times well into the 29-second bracket and occasionally beyond. The gaps between grades are not uniform. The difference between an A1 dog and a B1 dog is often smaller than the difference between a C3 dog and a D3 dog, because the lower grades contain a wider spread of ability. At the top, dogs are tightly clustered; at the bottom, they are more dispersed.
This matters when you read 450m results. A time of 28.40 seconds means very different things depending on whether it was posted in an A3 race or a C1. In the A3, it is a middling performance. In the C1, it signals a dog that might be on the verge of promotion. Calculated times — a standardised measure that adjusts for grade, going, and race dynamics — exist precisely for this reason. They allow you to compare dogs across different grade bands without being misled by raw clock numbers.
Promotion and relegation at Sunderland happen based on results within a set window of recent races. A dog that wins two consecutive 450m D-grade races will almost certainly move up. A dog that finishes in the bottom half of an A-grade field repeatedly will drop. The turnover is constant, and it means the grade of any individual race is a reliable but not perfect indicator of the quality on show. Dogs in transition — recently promoted or about to be relegated — are where value often lies in the 450m card, because their grade label has not yet caught up with their current form.
One final note on grade and time at this distance. Sunderland’s sand surface and its specific track geometry mean that 450m times here are not directly comparable with 450m times at, say, Nottingham or Romford. Each track has its own speed profile shaped by circumference, surface, and run-up distance. When assessing a dog that has transferred from another track, convert its times through a calculated-time adjustment rather than comparing raw numbers. The 450m is the most common distance in British greyhound racing, but a 28.00 at one venue is not the same as a 28.00 at another.