Sunderland Dogs Results: Race Data, Trap Statistics and Complete Track Guide
Every race. Every trap. Real data.
Best Greyhound Betting Sites – Bet on Greyhounds in 2026
Loading...
Sunderland Dogs Results: Race Data, Trap Statistics and Complete Track Guide
Sunderland Greyhound Stadium has been producing race results since 1940, and for most of that time the data told a simple story: six dogs, one winner, a finishing time. That was enough for the punter at the rail. It is not enough any more. The modern bettor wants sectional splits, calculated times, trap percentages, grade context and historical benchmarks before the hare even leaves the box. This guide exists because the data behind every race at Sunderland deserves more than a scrollable table on a bookmaker's sidebar.
Across these sections you will find a complete breakdown of Sunderland's greyhound racing operation: how the track plays, what the numbers mean, where the value hides in the betting markets and why this particular stadium — an all-weather sand circuit on the banks of the Wear — continues to matter in a sport that now operates across just 18 licensed GBGB tracks in the United Kingdom. Whether you are checking Sunderland greyhound results today after a Monday BAGS card or studying form ahead of Friday night's feature races, every number in this guide connects back to actual race data, official sources and real-world track behaviour.
The approach is deliberately analytical. Where other guides give you a list of distances and wish you luck, this one walks through trap statistics that prove Sunderland is one of the fairest tracks in the country, explains how to decode a finishing comment so it tells you more than the final position, and sets out a betting framework that respects both the mathematics and the unpredictability of six greyhounds chasing an Outside McGee around four bends of Wearside sand.
What Sunderland's Numbers Tell You at a Glance
- Sunderland runs four fixtures per week across four distances (261m, 450m, 640m, 828m) on an all-weather sand surface with a circumference of 378-379 metres and an Outside McGee hare.
- Trap statistics show approximately 17% win rate per trap, making Sunderland one of the most balanced tracks in UK greyhound racing — trap bias is nearly non-existent here.
- The favourite wins around 35.67% of graded races nationally; at Sunderland, the fair trap distribution means form and pace matter more than starting position.
- UK greyhound betting generated £794 million in turnover in 2023-24, and Sunderland's BAGS fixtures feed directly into that market every Monday, Wednesday, Friday and Sunday.
- The stadium's injury rate sits at the industry-wide record low of 1.07%, with welfare investment including £168,000 in track safety grants in 2024 alone.
Latest Sunderland Greyhound Results and Current Race Data

Sunderland greyhound results are published after every meeting, and with four fixtures per week the volume of data builds quickly. A typical week generates results from around 48 races — 12 per card on Monday, Wednesday, Friday and Sunday — each containing finishing positions, distances between runners, sectional times and race comments. For anyone tracking form or building a staking model, this is the raw material that everything else depends on.
The fastest way to check Sunderland greyhound results today is through the official stadium website, which publishes race-by-race outcomes shortly after each event concludes. Bookmaker platforms such as Bet365, William Hill and Paddy Power also carry results, though their primary purpose is commercial — the data is presented alongside immediate rebetting options rather than in a format designed for analysis. For deeper historical data, Greyhound Stats UK provides searchable archives covering multiple seasons at Sunderland and every other GBGB-licensed track.
What makes Sunderland's results particularly useful for comparative analysis is the volume. Four meetings per week, 12 races per meeting, across multiple grades and all four distances — the dataset accumulates quickly. A bettor who follows Sunderland consistently for even a few weeks builds a sample size large enough to spot patterns: which trainers are running their dogs into form, which grades are producing competitive fields, and which dogs are quietly improving their calculated times without the finishing positions reflecting it yet.
Each result line contains several fields that casual observers tend to skip. The finishing position is obvious, but the distance beaten (expressed in lengths), the sectional time to the first bend, the run comment from the stipendiary steward and the calculated time all add layers. A dog that finishes third, beaten two lengths, but posted the fastest sectional to the first bend and was noted as suffering crowding at the second turn tells a very different story from a dog that finished third having led for most of the race and faded. The raw position is the same; the information is not.
Sunderland's all-weather sand surface means results data carries unusual consistency. Finishing times from different meetings can be compared with greater confidence than at many other UK tracks, making this one of the better venues for data-driven analysis.
How to Read Sunderland Greyhound Results
A Sunderland greyhound result is not a scoreline. It is a compressed data record, and reading it properly requires knowing what each field represents and — more importantly — what it conceals. The format follows the standard GBGB template used across all 18 licensed tracks, but the way those numbers behave at Sunderland is shaped by the track's specific geometry, surface and hare system.
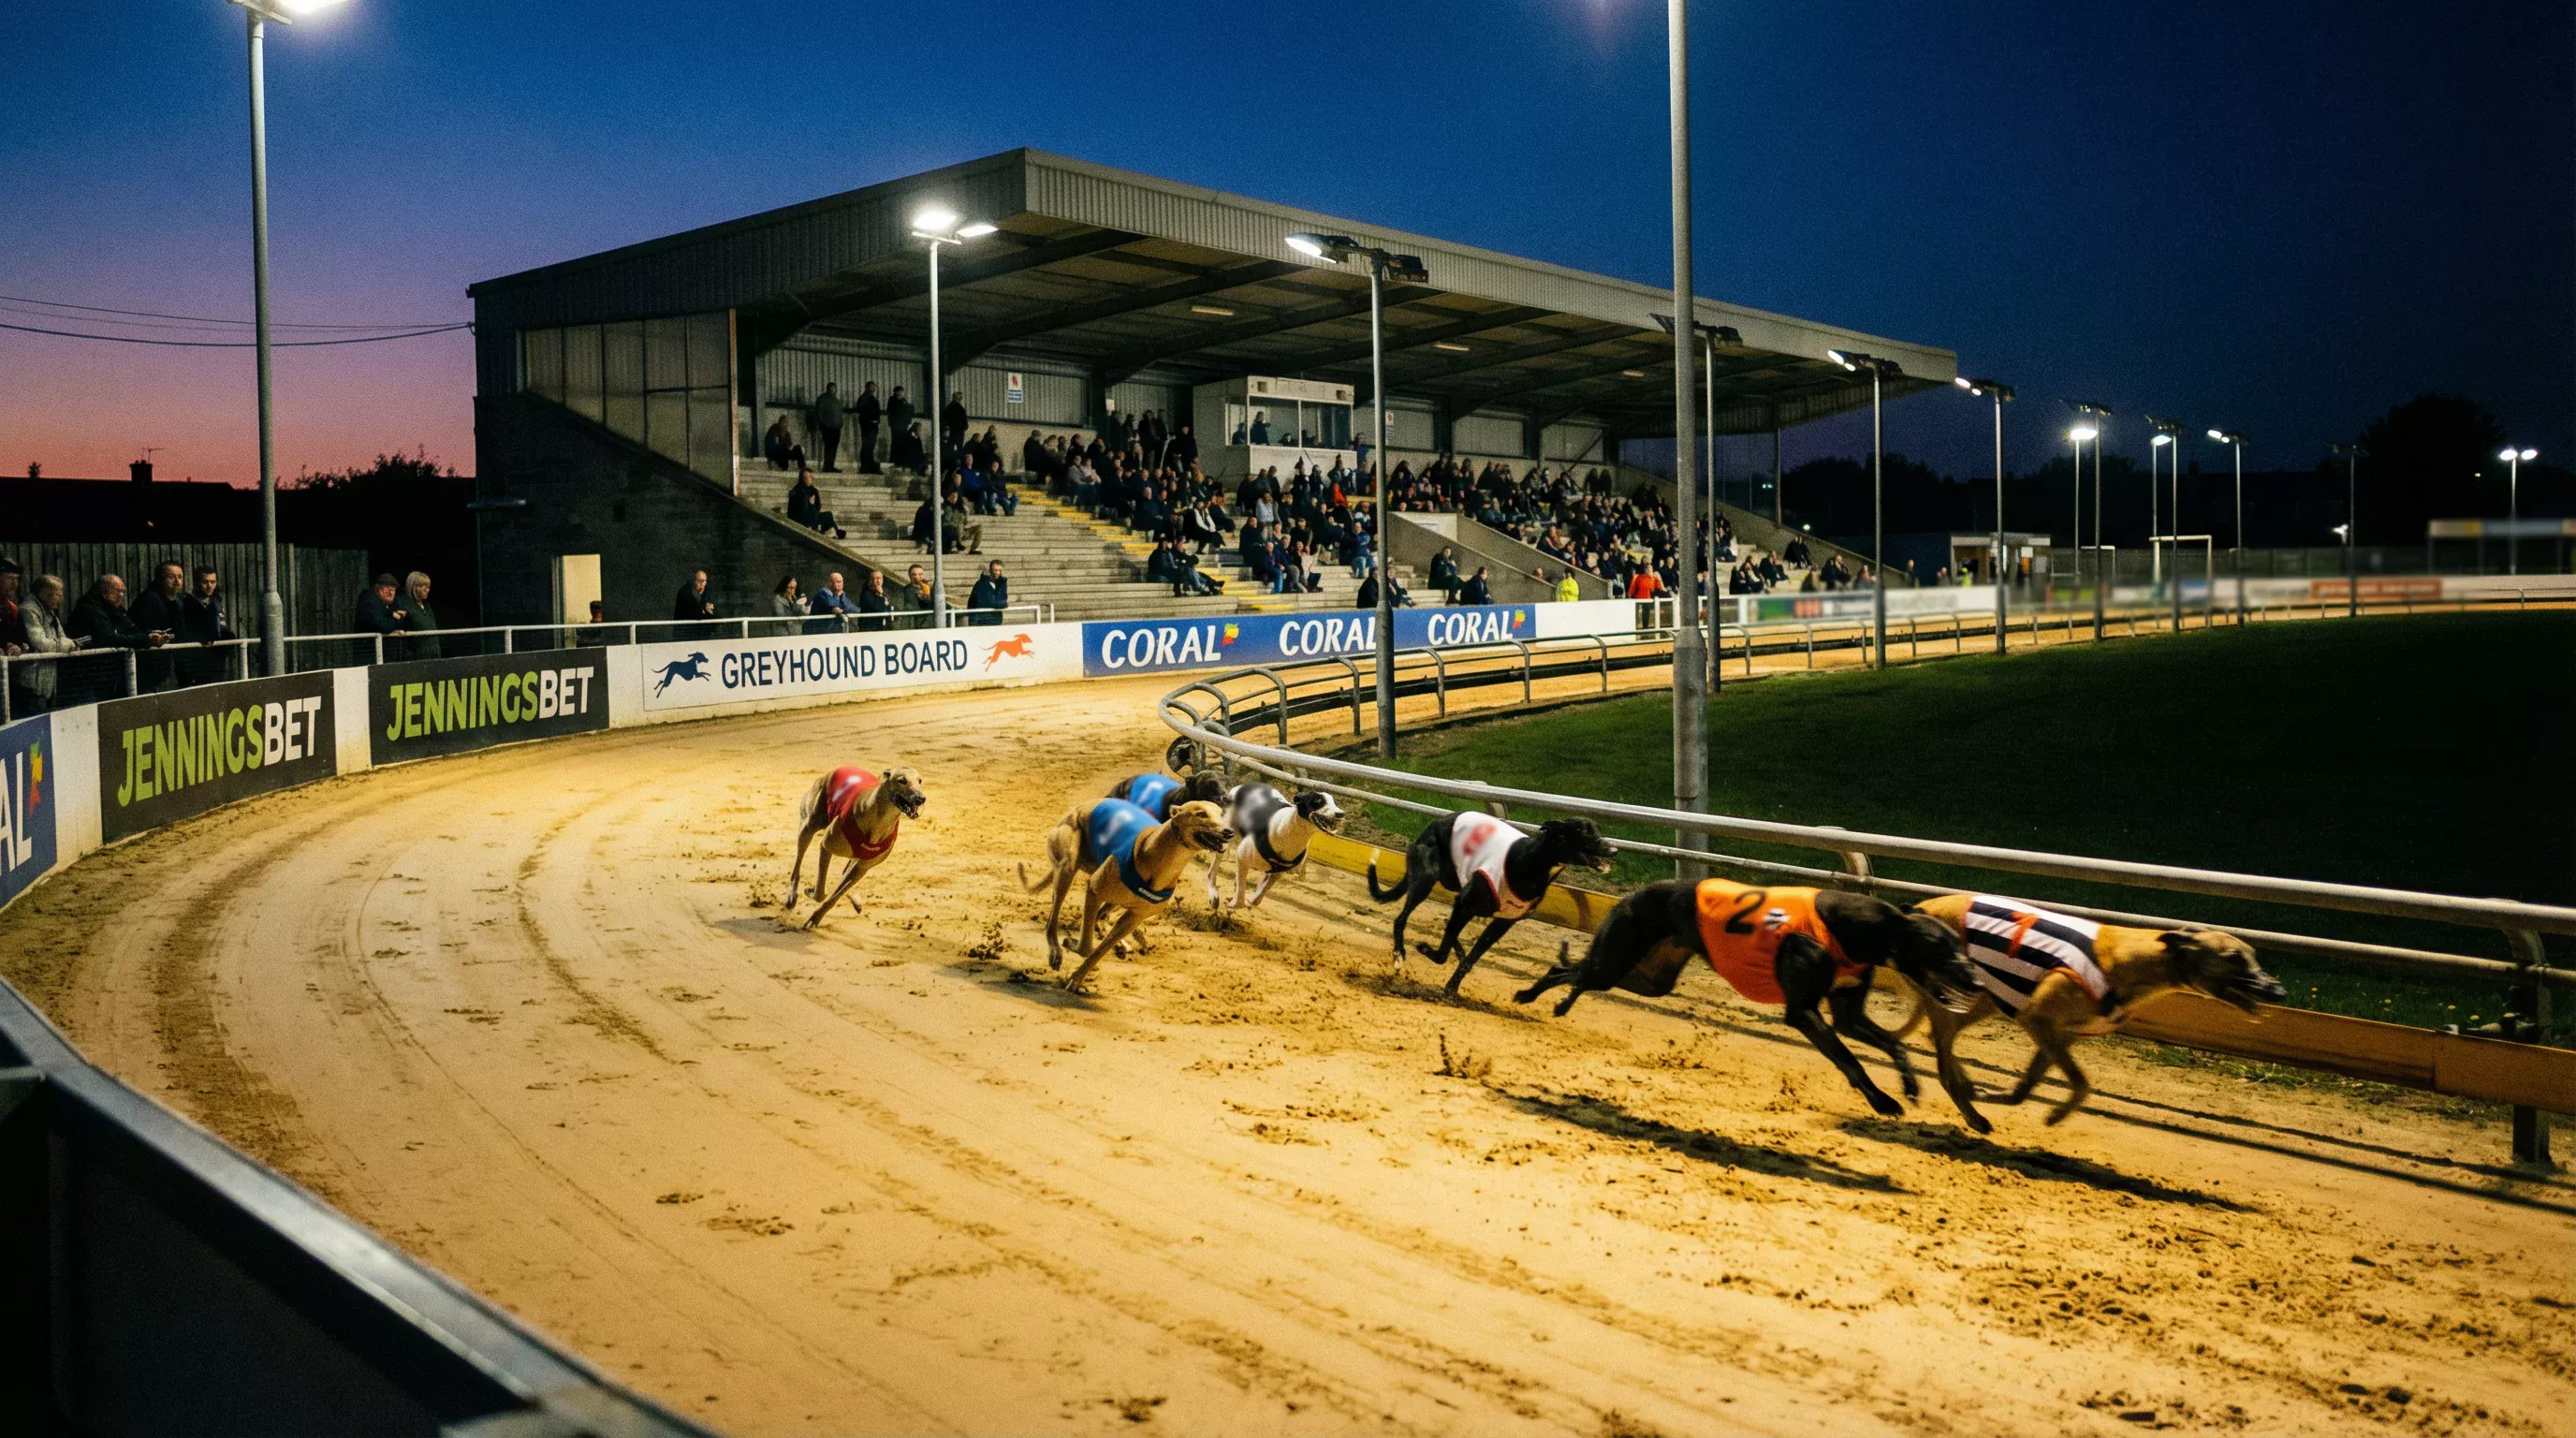
Every result line starts with the finishing position, expressed as a number from 1 to 6. Beside it you will find the dog's name, trap number (colour-coded: red, blue, white, black, orange, striped), the starting price and the finishing time in seconds. So far, straightforward. But the next columns — distance beaten, sectional time, run comment and calculated time — are where the real information lives.
The distance beaten is measured in lengths, with one length equivalent to roughly 0.08 seconds at standard greyhound sprint speed. A result reading "2nd, 1½L" means the dog finished approximately 0.12 seconds behind the winner. At Sunderland's 450m distance, where winning times in A-grade races typically fall between 27.8 and 28.4 seconds, a length and a half represents a gap that could be closed by a slightly better break from the traps or a cleaner run through the first two bends. Context matters: 1½ lengths in a D4 race (where the pace is slower) represents a larger proportional gap than in an A1.
Sectional times measure the dog's speed to a specific checkpoint — usually the first bend. At Sunderland, the distance from boxes to the first turn is 93 metres on the 450m course and 84 metres on the 640m course. These sections reveal early pace independently of what happens in traffic later on. A dog that consistently posts fast sectionals but finishes mid-pack is being compromised by crowding or wide running — information you cannot extract from the final position alone.
Run Comments — the steward's shorthand notation after each race tells you how a dog ran. Common codes include "EP" (early pace), "Mid" (ran in mid-division), "SAw" (slow away from traps), "Crd" (crowded/checked during running), "Wide" (ran wide on bends) and "RnUp" (ran up to challenge). At Sunderland, where the bends are relatively tight given the 378-metre circumference, crowding comments on the first and second bends are particularly significant because dogs lose more ground on tighter turns.
Calculated time is the most analytically useful field and the one most often ignored. It removes the effect of interference by estimating what the dog would have run had it raced unimpeded. The formula typically adds back time lost through crowding, slow starts or wide running, producing a normalised figure that allows comparison across different races and grades. At Sunderland, where the near-equal trap distribution means positional interference is broadly random rather than systematically biased, calculated times are especially reliable.
Weight is recorded for every runner and published in the result. Greyhounds at Sunderland typically race between 26kg and 36kg. A weight change of more than 0.5kg between races can indicate a change in condition, and consistent weight across several runs suggests a dog in stable training form.
The grade of the race — from A1 (highest graded level) down to D4 (lowest) — frames everything else. A finishing time of 28.30 in an A2 race at 450m means something entirely different from 28.30 in a D3. The speed is identical; the competition is not. When comparing Sunderland dogs results tonight across different grades on the same card, always normalise for class before drawing conclusions about relative ability.
Calculated Time (CT) — an adjusted finishing time that accounts for interference during the race. It estimates the time a greyhound would have recorded if it had a clear, unimpeded run. Used by form analysts to compare dogs across different races regardless of in-running trouble.
Sunderland Track Overview: Circuit, Surface and Character
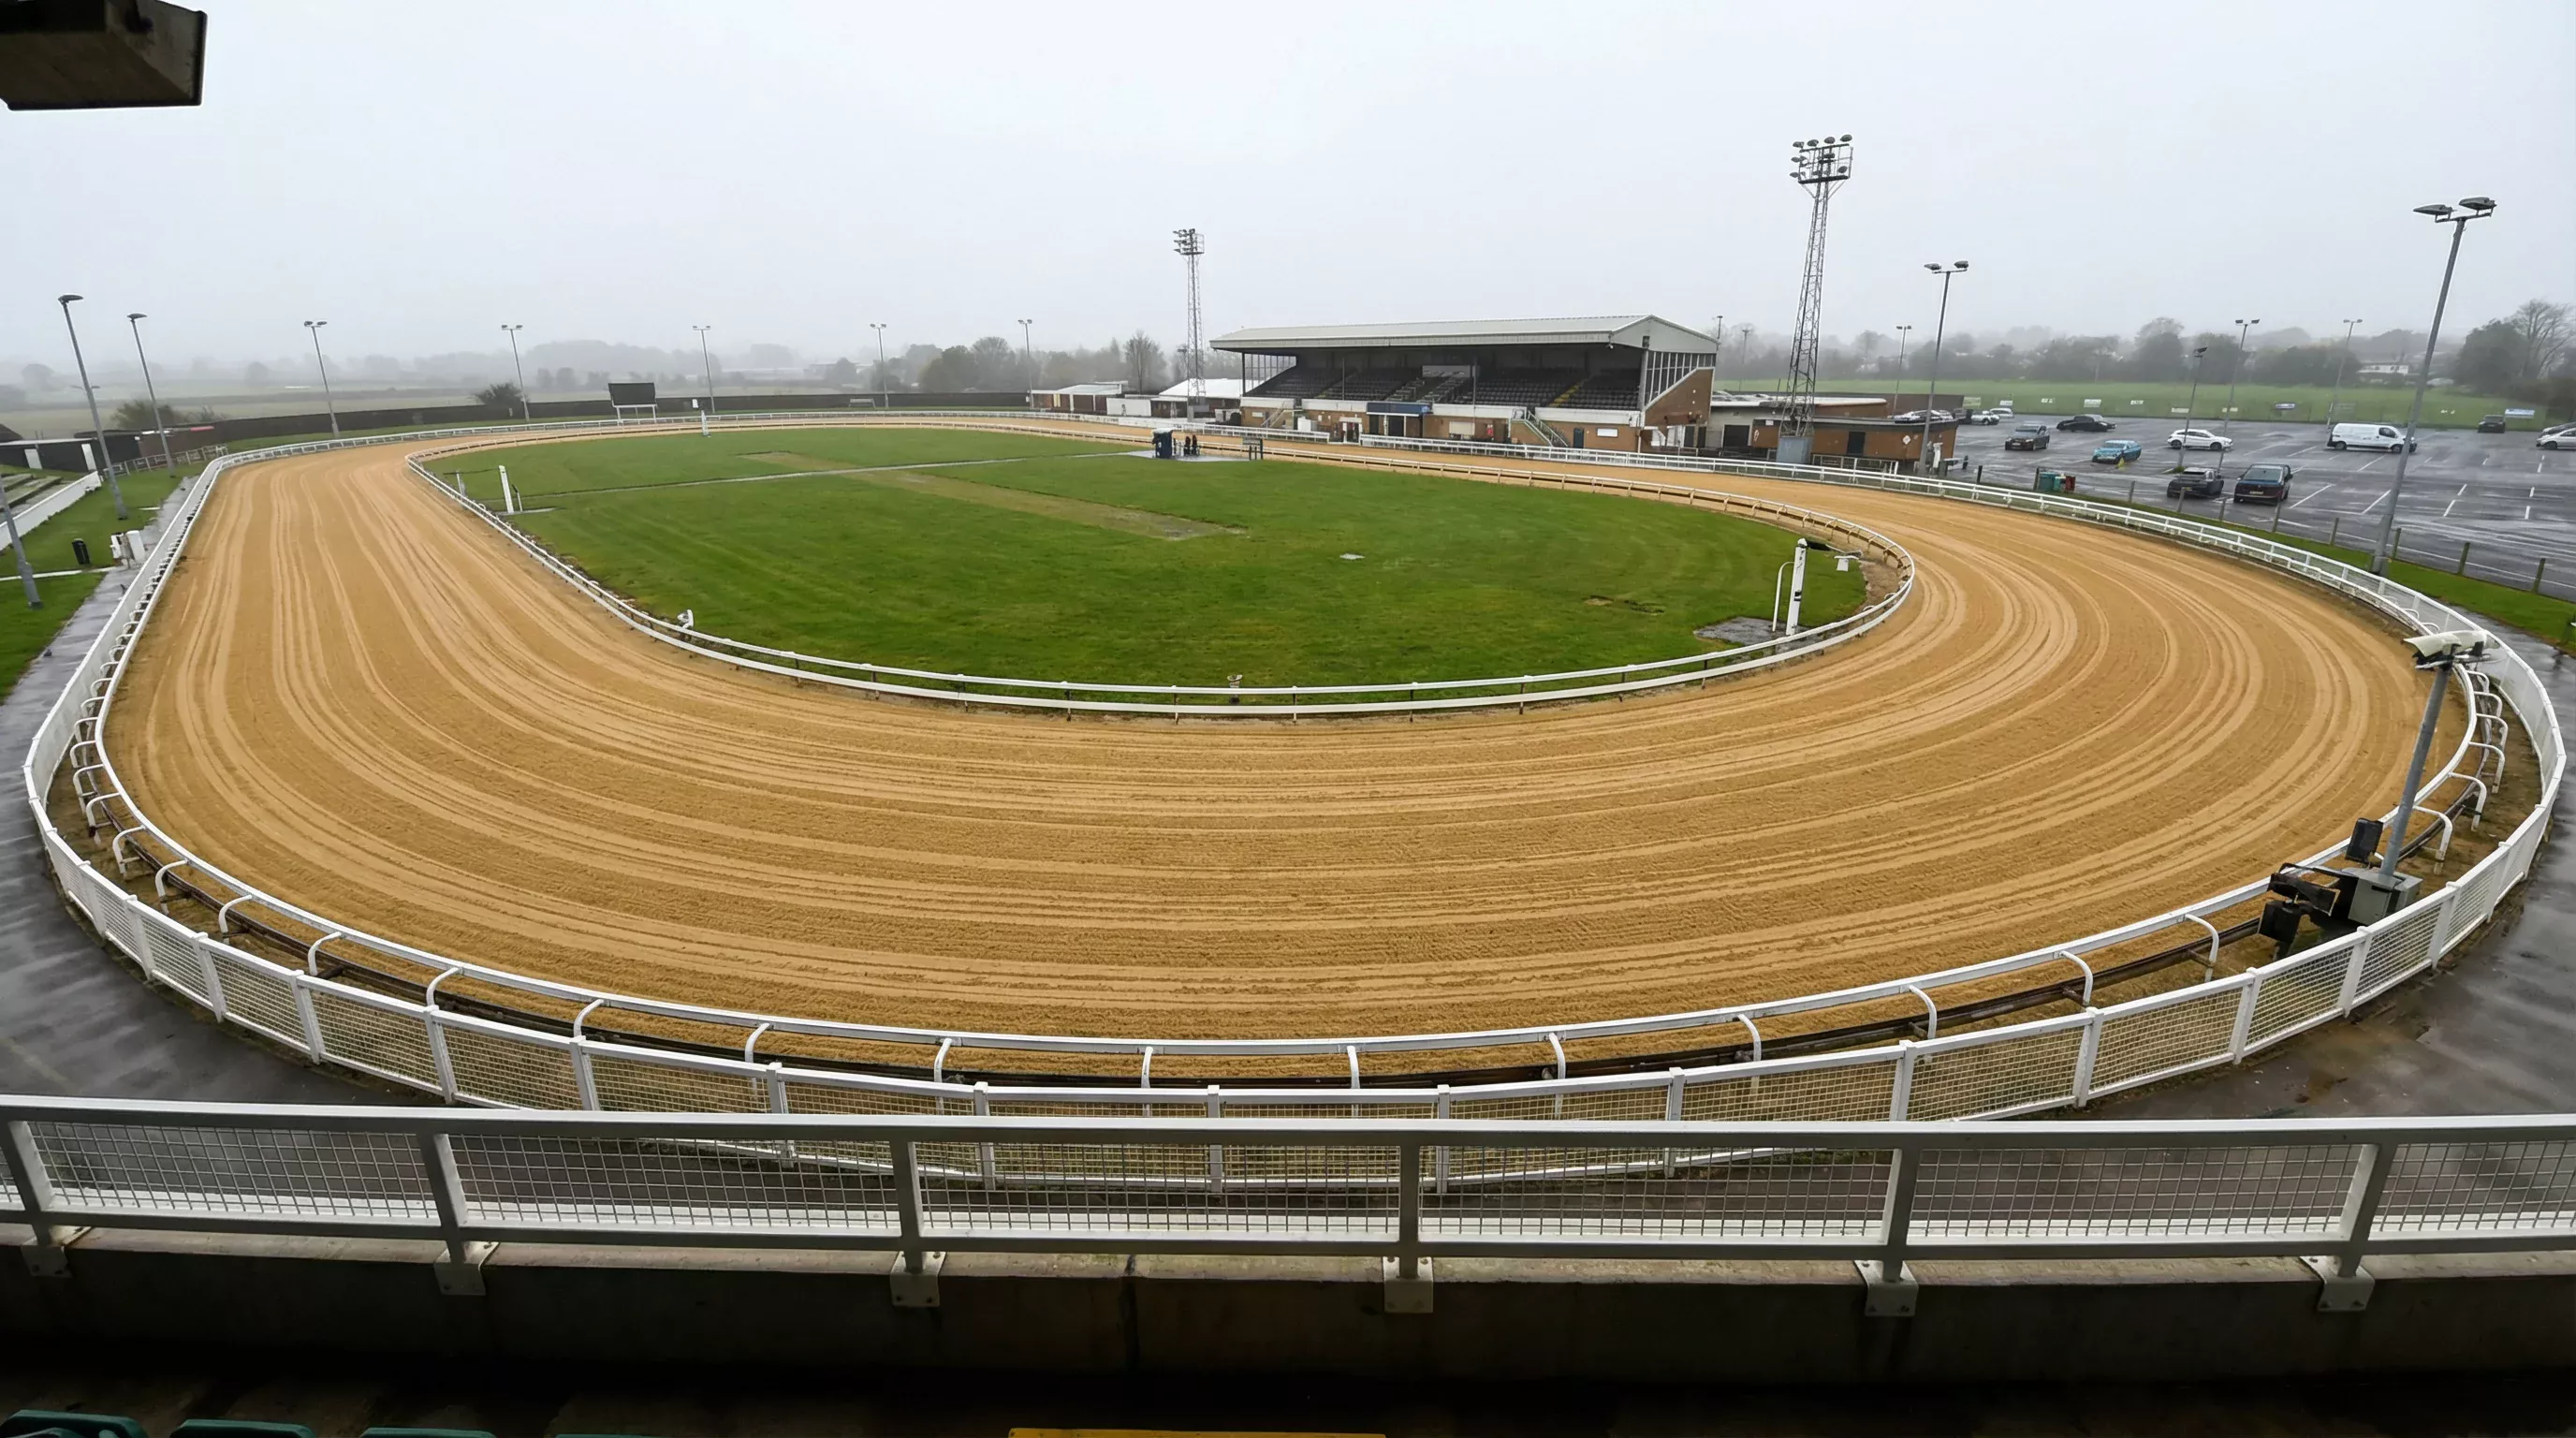
Sunderland Greyhound Stadium sits on a stretch of industrial heritage land in the Fulwell area of the city, about two miles north of the River Wear. It has been a working greyhound track since March 1940 and, under current ownership by Arena Racing Company, operates as one of 18 GBGB-licensed stadiums in the United Kingdom. The sport's footprint has contracted significantly — Scotland's last active greyhound track suspended operations in March 2025, and Wales is legislating to ban greyhound racing entirely under the Prohibition of Greyhound Racing (Wales) Bill introduced in September 2025. Against that backdrop, Sunderland's ongoing viability matters not just locally but as part of an industry employing approximately 500 trainers, 3,000 kennel staff and around 15,000 registered owners.
What defines Sunderland as a racing venue is its surface, geometry and reputation for fairness. The all-weather sand track produces consistent going conditions across seasons, making data from this circuit unusually reliable for comparative analysis.
The GBGB's welfare framework applies uniformly across all licensed tracks, and the results are measurable. The industry-wide injury rate dropped to a record low of 1.07% in 2024 — meaning 3,809 injuries across 355,682 individual race starts. That figure reflects improvements in track maintenance, veterinary presence and the design of safety features like cushioned running rails and bend cambers. As GBGB Chief Executive Mark Bird noted: "The initiatives we have introduced in recent years are now embedded and are helping to consolidate the significant progress we have made since 2018 across all measures." — Mark Bird, Chief Executive, GBGB.
Sunderland's character as a track is best described as honest. The geometry does not dramatically favour inside or outside runners, the sand surface does not punish particular running styles, and the graded race programme — from D4 up through A1 to Category One open competitions — provides a structured competitive ladder. For the data-minded bettor, this honesty is a feature: it means the form book tends to be more predictive here than at tracks with pronounced biases or surface inconsistencies.
Distances at Sunderland: 261m, 450m, 640m and 828m
Sunderland offers four racing distances, each with its own tactical profile and its own set of demands on the greyhound. Understanding how races unfold at each distance is fundamental to interpreting results correctly, because a dog's form over 261m tells you almost nothing about how it will perform over 828m — and vice versa.
The 261m sprint is the shortest distance on the card and the most volatile for bettors. The race starts on the back straight and covers approximately one turn before reaching the finish line. There is virtually no time for a dog to recover from a poor break, which makes the trap draw and the first stride out of the boxes disproportionately important. Sprint specialists tend to be lighter dogs — often in the 27-30kg range — with explosive early acceleration. Sectional times at this distance effectively tell you the whole story, because there are not enough bends for tactical positioning to develop. If a dog does not lead through the first turn at 261m, it very rarely wins.
The 450m standard distance is the backbone of Sunderland's racing programme. The majority of graded and BAGS races are run over this trip, which covers two full turns from the boxes on the home straight. The 93-metre run to the first bend gives dogs time to find their position, and the two bends that follow are where most of the race interference occurs. Good 450m dogs balance early pace with the ability to sustain speed around the final turn. At A-grade level, winning times typically fall between 27.7 and 28.5 seconds depending on grading and conditions.
The 640m stayers distance introduces an additional element: stamina. Dogs start on the back straight, 84 metres from the first turn, and must sustain their effort for roughly 40 seconds — almost half as long again as the standard trip. Pace analysis at 640m often reveals that the leaders at the second bend are not the same dogs finishing first. Late-closing runners with strong second-half splits thrive here, particularly on Sunderland's sand, which becomes marginally more demanding over longer distances because the surface absorbs slightly more energy with each stride than a firmer track would.
The 828m marathon is the rarest distance on the Sunderland card and the one that separates the genuine stayers from the merely quick. At nearly two full laps of the circuit, this distance tests both physical endurance and racing intelligence. Marathon greyhounds need to conserve energy through the first half without losing touch, then accelerate through the final two bends. The extra distance filters out the randomness that shorter races allow, which means marathon results tend to be the most form-reliable at Sunderland.
The 828m marathon at Sunderland covers just over two complete laps of the circuit. A dog running the distance at top grade would be on the track for approximately 53-55 seconds — roughly the same time it takes to boil a kettle, but with considerably more tactical complexity involved.
Track Specifications: Circumference, Hare and Bends
The numbers that define Sunderland's physical layout are straightforward: a circumference of 378 to 379 metres (sources vary marginally), four bends, an all-weather sand surface and an Outside McGee mechanical hare. Those specifications place Sunderland in the mid-range of UK greyhound tracks by size — smaller than Towcester's 420-metre circuit but larger than several inner-city venues.
The Outside McGee hare runs on an external rail, which means dogs chase a lure that travels around the outside of the track rather than on an inside rail as at some other venues. This has a subtle but measurable effect on race dynamics: the hare's distance from the dogs is greater on the bends, which can influence how tightly runners take the turns. At tracks with an inside hare, dogs tend to cut in more aggressively. At Sunderland, the outside hare encourages a slightly wider racing line, which arguably contributes to the track's balanced trap statistics.
Track safety infrastructure at Sunderland benefits from industry-wide investment. In 2024, the GBGB's Track Safety Committee distributed £168,000 in grants across licensed stadiums for safety equipment including cushioned running rail coverings, sand maintenance machinery and track monitoring systems. Sunderland, as an ARC-owned venue, also benefits from the company's centralised maintenance programme, which standardises sand grading schedules and drainage protocols across its portfolio of tracks.
The four bends at Sunderland are cambered — banked slightly — to help dogs maintain speed through the turns. A well-cambered bend allows inside runners to hold their line without losing ground, while a flat bend forces dogs wide and creates interference. Sunderland's cambers are generally considered adequate for the circuit's size, contributing to the track's balanced trap performance data.
Trap Statistics: Fairness Data by Starting Position
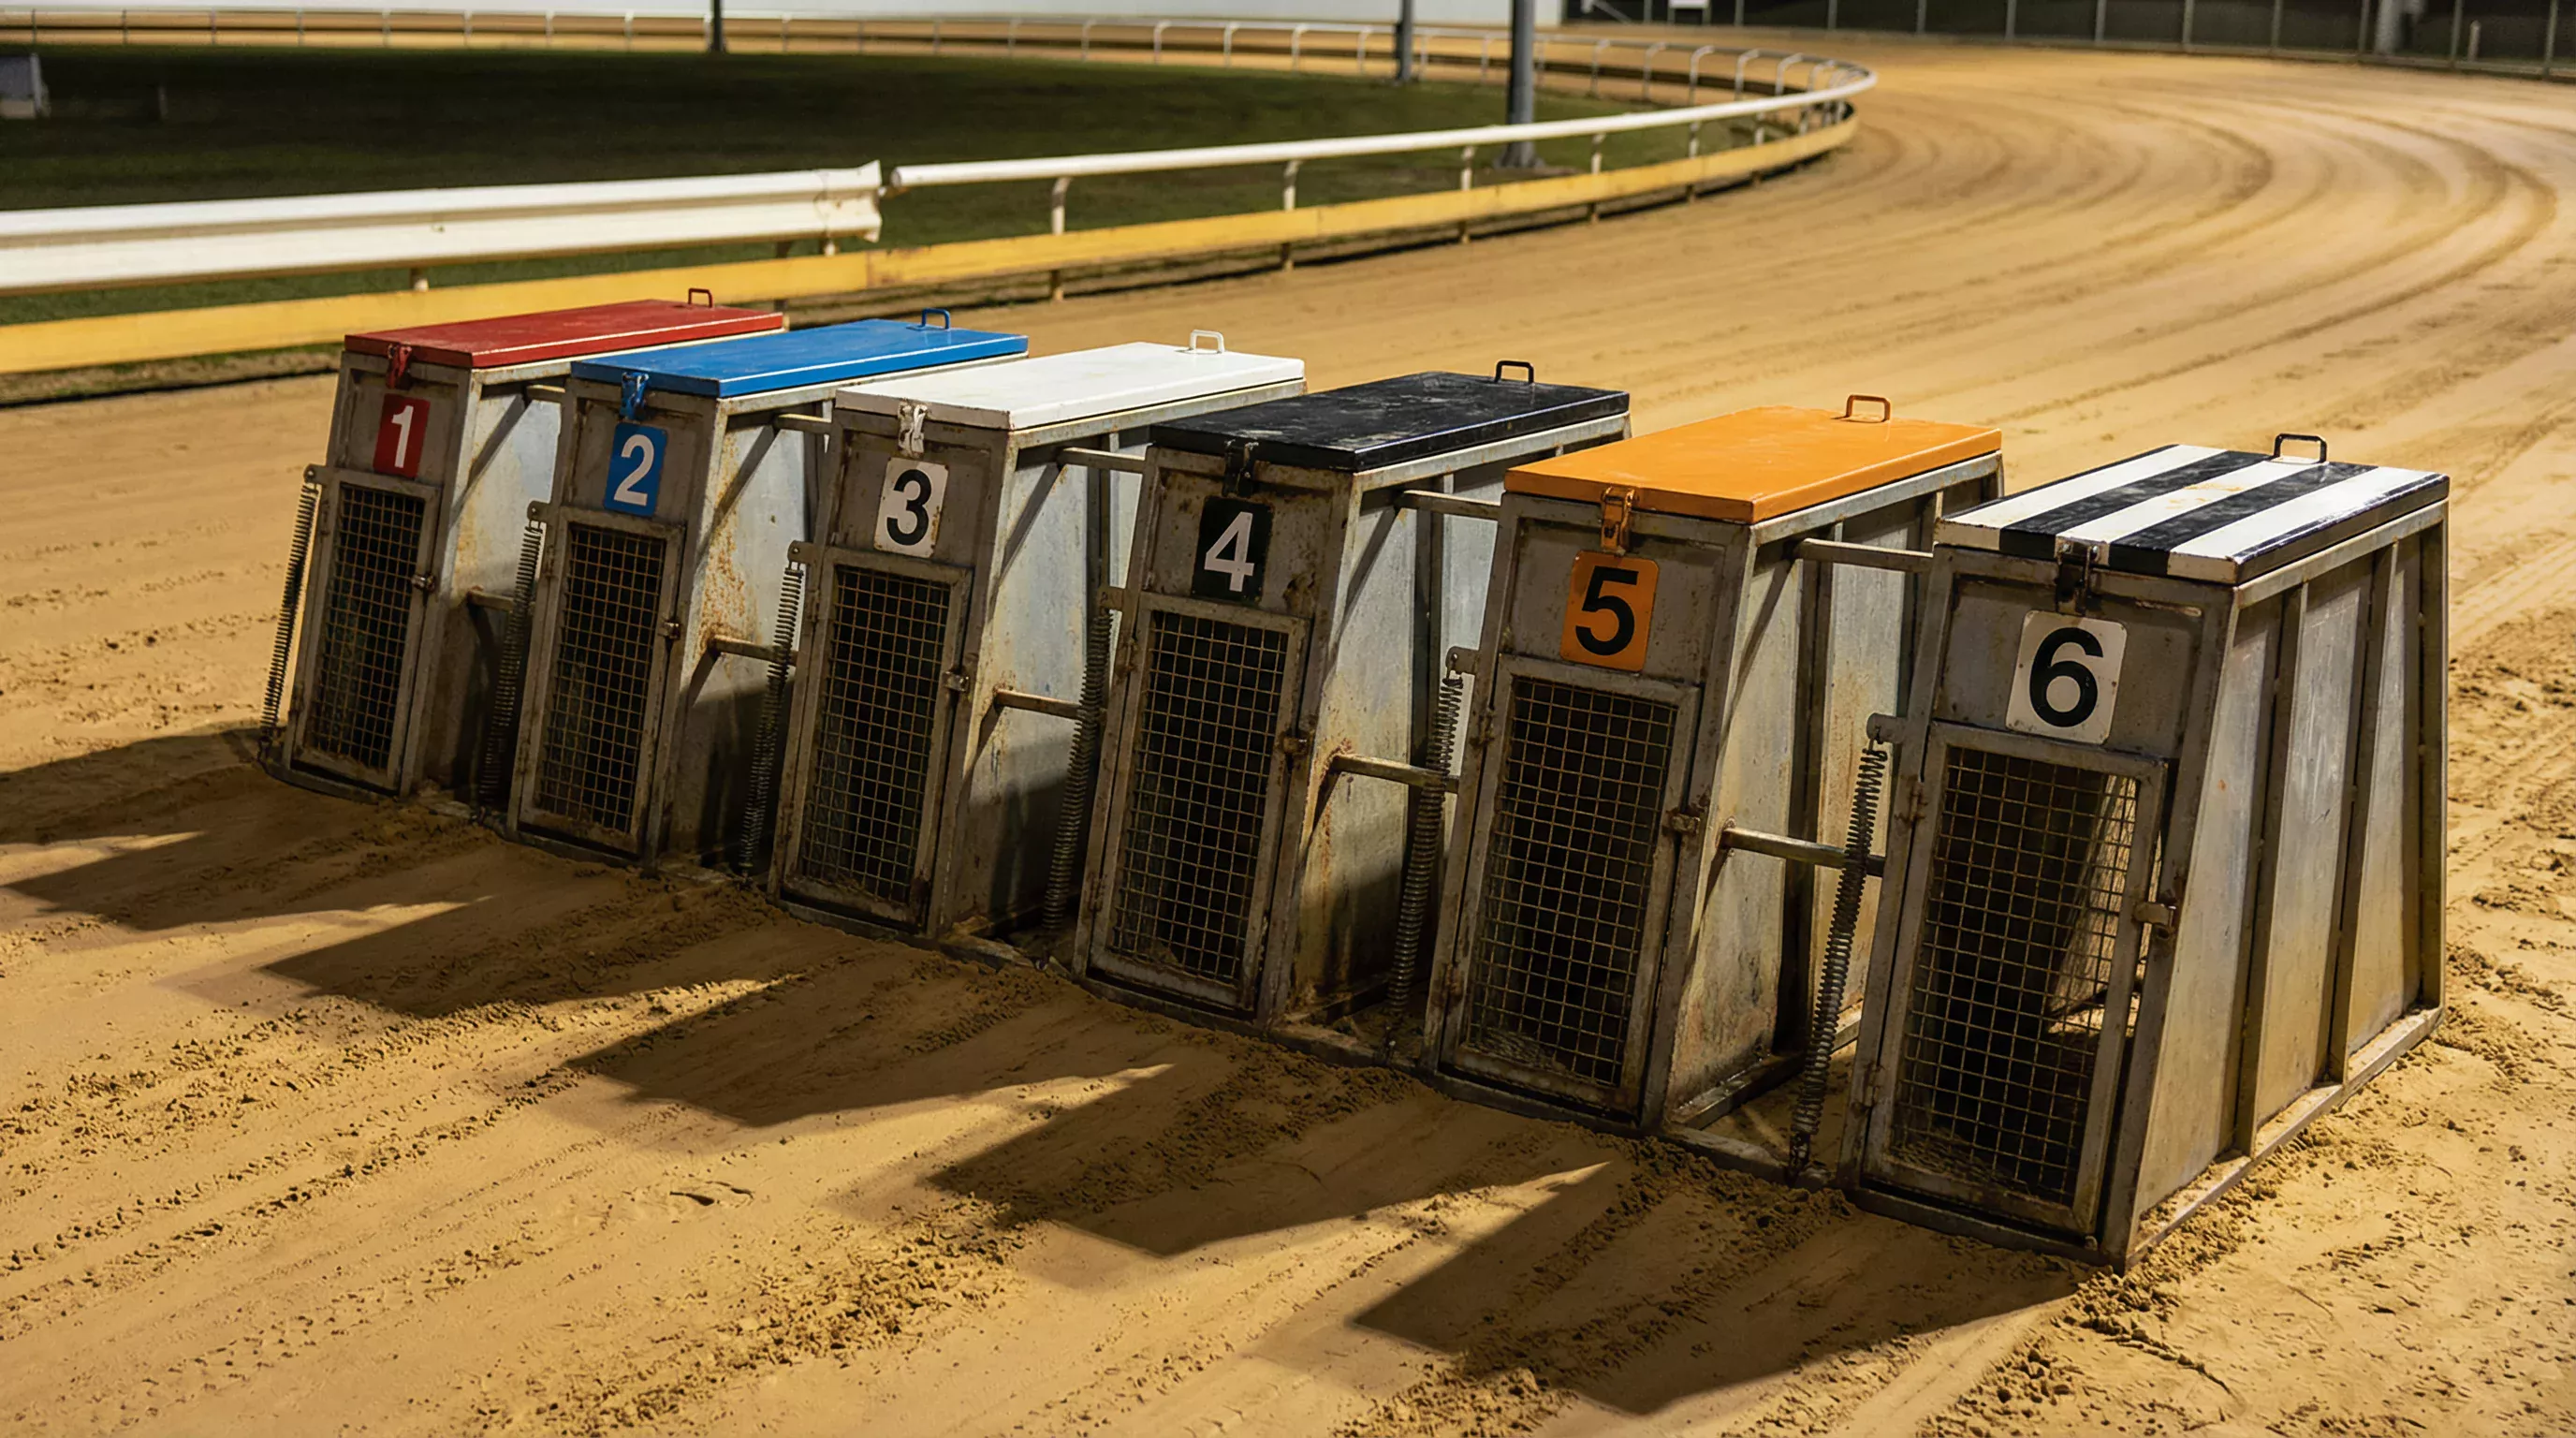
If there is one data point that defines Sunderland's reputation among serious greyhound bettors, it is the trap distribution. Across a sustained sample of results, each of the six traps at this stadium wins approximately 17% of races. In a theoretically perfect system with no bias whatsoever, each trap would win 16.67% of the time. Sunderland comes closer to that ideal than almost any other licensed track in Britain.
To appreciate why this matters, consider the national picture. According to analysis from The Game Hunter's trap bias study, Trap 1 at UK tracks averages a win rate of 18-19% rather than the theoretical 16.67%, because the inside box benefits from a protected rail position through the first bend. At many tracks, this built-in advantage means Trap 1 runners are systematically overbet relative to their actual superiority, while Trap 6 runners — exposed on the outside — are systematically undervalued. At Sunderland, that effect is minimal. The combination of the Outside McGee hare, the track's specific bend geometry and the consistent sand surface produce conditions where no single trap position offers a persistent structural edge.
The practical consequence for bettors is significant. At a track with pronounced trap bias, you need to adjust your assessment of every runner based on their box draw before considering anything else. A dog with strong form drawn in a disadvantaged trap requires a mental discount; a dog with moderate form drawn favourably needs a premium. At Sunderland, you can largely skip that step. Form, fitness, pace and grade are the primary drivers of outcomes here — not starting position.
Data from Greyhound Stats UK allows you to verify this yourself. Pull up the trap statistics for Sunderland over any rolling 12-month period and you will see the numbers cluster tightly around that 17% mark. There will be minor fluctuations — a trap might hit 18% one quarter and 15.5% the next — but the long-term picture is remarkably flat. Compare that to tracks where Trap 1 routinely wins 20% or more, and you understand why analysts describe Sunderland as one of the fairest circuits in the country.
This fairness extends across all four distances, though with nuance. At the 261m sprint, where the race is decided by the first bend, trap position carries slightly more weight. At 640m and 828m, the extended distance allows early interference to wash out and the trap effect diminishes. The 450m standard distance — where the bulk of Sunderland's races are run — is where balanced trap statistics are most valuable for forecasting.
Sunderland's trap statistics hover around 17% per box, making it one of the most evenly balanced tracks in UK greyhound racing. For bettors, this means form and pace analysis take precedence over trap-draw adjustments — a rarity in this sport.
Race Schedule: Days, Times and BAGS Integration
Sunderland Greyhound Stadium operates four fixtures per week under the Premier Greyhound Racing banner: Monday (daytime), Wednesday (daytime), Friday (evening) and Sunday (morning). Each meeting typically features 12 races, meaning the stadium generates around 48 individual race results per week — a volume that matters if you are tracking form across meetings or building a statistical sample of track behaviour.
The scheduling is not arbitrary. It is driven by the Bookmakers Afternoon Greyhound Service, better known as BAGS, which contracts tracks to supply live racing content to betting shops and online platforms throughout the day. BAGS is the financial engine of UK greyhound racing below the prestige level: roughly 5,772 greyhounds participate in 74 BAGS meetings every week across the country, and BAGS distributes approximately £26 million per year to contracted stadiums. Sunderland's Monday, Wednesday and Sunday cards feed directly into this system, broadcast via SIS to bookmakers nationwide.
Friday night stands apart. While the daytime BAGS fixtures are commercial operations designed to supply content to betting shops during trading hours, Friday is the stadium's public-facing showcase — a social event as much as a racing fixture. Gates open earlier, the restaurant and hospitality packages are in full operation, and the crowd includes first-timers and group bookings alongside the regulars. For bettors, the Friday card is also the most likely to feature higher-graded races and open-race trials, because trainers and the racing office use the evening meeting to showcase their better dogs in front of a larger audience.
The seasonal calendar adds another layer. Sunderland hosts two Category One events — the highest classification in UK greyhound racing. The ARC Grand Prix runs in April with a £12,500 prize fund, and the ARC Classic takes place in November. In the weeks leading up to these events, the graded cards often function as unofficial trials, with trainers placing their stronger runners over the relevant distance to sharpen fitness and establish current form. The spring 2026 Grand Prix qualifying period is a particularly useful window for bettors, because the data generated in March and early April reveals which dogs are approaching peak condition.
Understanding the schedule matters for bettors because Monday's daytime BAGS card produces fundamentally different racing from Friday evening. Daytime cards tend to be weighted toward lower and middle grades — B3, C1, D2 — because these divisions have the largest populations of active dogs. Friday night features a broader spread, from featured A-grade races down to lower-grade support events. The grade profile of each fixture day is essential context when studying Sunderland greyhound racing results.
The schedule determines when data is generated; the form guide determines what that data means. Knowing which dogs ran — and how — leads directly into the next question: how to read their form.
Form Guide Explained: Reading Sunderland-Specific Form
Form is the single most predictive tool available to a greyhound bettor, and at Sunderland it works better than at most tracks. The reason goes back to the surface: the consistent all-weather sand reduces the random variability that makes form unreliable at venues where going conditions change between meetings. When you read a dog's last six runs at Sunderland, you are comparing like with like to a greater extent than almost anywhere else in the sport.
The standard form display shows a dog's finishing positions in its most recent races, typically presented as a six-figure sequence — for example, 231142. Each digit represents a finishing position (1st through 6th), and reading left to right, the most recent run appears first. But the numbers alone are insufficient. A dog showing 231142 might be improving, declining, or performing inconsistently depending on the grades of those races, the distances involved and the run comments attached to each outing.
Calculated times are the analytical backbone of Sunderland form assessment. Because the track's balanced trap statistics mean that interference is broadly random — not systematically linked to any particular starting position — calculated times here are more meaningful than at tracks where Trap 6 dogs consistently lose ground through bias rather than through genuine traffic. When you see a calculated time of 28.15 at Sunderland's 450m, you can treat it as a reasonably clean indicator of that dog's ability, without needing to apply the heavy adjustments that some other circuits demand.
Weight trends are the second most underused data point in the form guide. The registration system requires every greyhound to be weighed before racing, and the figure appears in the result data. A dog maintaining steady weight across four or five runs is almost certainly in stable training condition. A dog whose weight has dropped by a kilogram over two outings might be racing too frequently, recovering from illness, or simply not thriving. At Sunderland, where the all-weather surface means the track itself does not create excessive physical stress compared to harder surfaces, weight loss is more likely to reflect an issue with the dog rather than an issue with conditions.
One Sunderland-specific consideration is the origin of greyhounds in the racing population. According to GBGB registration data for 2024, 84.5% of 5,133 newly registered greyhounds came from Ireland, with 15.5% bred in Britain — up from 13.1% in 2021, as Irish imports declined by 26%. This matters because Irish-bred dogs arrive with trial form from tracks using different surfaces and geometries. Their early Sunderland races often represent a learning curve, and savvy form readers watch for the run where an Irish import adapts to the sand — identifiable by a sharp improvement in calculated time without any change in grade.
Going conditions at Sunderland default to "standard" because the all-weather sand does not exhibit the range of conditions found on turf or mixed surfaces. Heavy rain can make the surface marginally slower before drainage catches up; extended dry heat can firm it and produce faster times. These variations are small, but over a 450m race measured in tenths of a second, they can shift a short-head margin into a length.
When assessing form, always check the grade column alongside the finishing position. A run of 1-1-2 in D3 races does not indicate the same ability as 3-4-3 in A2 races. The dog with worse raw positions but higher-grade opposition is almost certainly the superior runner. Sunderland's structured grading system means this distinction is consistent and reliable.
Track Records: All-Time Bests by Distance
Track records at Sunderland serve two purposes: they honour the fastest dogs to have raced at the stadium, and they provide benchmarks against which current performance can be measured. Every time a runner posts a finishing time within a second of the track record for its distance, that performance carries additional significance — it is running at or near the physical limit of what the surface and geometry allow.
Records at Sunderland are held across all four distances. The 261m sprint record reflects the limits of raw acceleration: a time achieved by a dog that broke cleanly, hugged the rail through the single bend and powered through the finishing straight without interference. The 450m standard record is the most competitive, because the volume of racing at this distance means the population of dogs who have contested it is largest. The 640m and 828m records are set by specialists — stayers and marathon dogs whose physical and tactical qualities align with the specific demands of those trips.
Historical context matters when evaluating track records. Sunderland's surface has been relaid and maintained at different standards across different ownership eras. The current ARC ownership period, beginning with the acquisition from William Hill in May 2017, brought standardised maintenance protocols and investment in track infrastructure. Times set under current conditions are therefore most directly comparable to each other, while records from earlier decades should be understood as products of different surface conditions and possibly different track geometries (the circuit has undergone modifications at various points in its 85-year history).
For bettors, track records function as a ceiling reference. If the record for 450m is 27.50 seconds and a dog in tonight's A1 race has a calculated time of 27.85, that dog is performing within 1.3% of the all-time best. That proximity suggests the dog is at or near peak ability, and further improvement will be marginal. A dog in the same grade posting 28.60 has a much larger gap, suggesting either underperformance or a grading above true ability.
The 2025 English Greyhound Derby, won by Droopys Plunge at Towcester in a closely contested final, serves as a useful external benchmark. While Towcester and Sunderland are fundamentally different circuits — Towcester's 420-metre circumference and different surface produce different absolute times — comparing a dog's relative performance against its own track record with elite-level performances elsewhere gives a rough measure of where a Sunderland runner sits in the national hierarchy.
The very first winner at Sunderland Greyhound Stadium was a dog called Percheron, which won from trap 2 at odds of 5/2 on the opening night of 23 March 1940, posting a time of 28.35 seconds. Eighty-five years of timing technology and surface science later, A-grade dogs over 450m at the same venue run in broadly similar territory — a reminder that greyhound speed has a biological ceiling, even if everything else about the sport has changed.
Betting Guide: Strategies Shaped by Sunderland Data
Betting on greyhounds at Sunderland should start with one acknowledgement: the UK greyhound betting market is not a niche afterthought. Total betting turnover on greyhound racing in Britain reached £794 million in the 2023-24 reporting period, according to Gambling Commission data. That is a market large enough to attract sophisticated pricing from bookmakers, but not so liquid that inefficiencies are instantly arbitraged away. For a bettor armed with track-specific data, Sunderland offers genuine opportunities — provided the approach is disciplined.
The starting point at this track is the trap-distribution data discussed earlier. Because each trap wins approximately 17% of races — close to the 16.67% theoretical baseline — you are operating on a level playing field in terms of starting position. That means your primary variables are form, grade, pace profile and calculated time. At tracks with heavy trap bias, a significant portion of your edge (or disadvantage) comes simply from the draw. At Sunderland, the edge has to come from reading the form better than the market.
The favourite in UK graded greyhound races wins approximately 35.67% of the time, based on OLBG analysis of 2024 race data. That figure carries important implications. It means the favourite loses nearly two-thirds of all races, which is a far higher failure rate than in horse racing, where market leaders win closer to 33-38% depending on the type of race. For Sunderland specifically, the fair trap statistics mean that the favourite's failure rate is not being artificially inflated by trap bias — when the favourite loses here, it is usually because another dog was genuinely better on the day, not because the draw was against it.
Forecast and tricast betting is where Sunderland's balanced characteristics pay dividends. A straight forecast requires predicting the first and second finishers in order; a tricast requires the first three. At tracks with trap bias, Trap 1 is disproportionately likely to feature, compressing the odds. At Sunderland, all six traps are realistic contenders, so Computer Straight Forecast and Computer Tricast returns tend to be higher on average.
Mark Kingston, Director of Premier Greyhound Racing, has described the relationship between the sport and the betting industry directly: "Greyhounds have always been a fundamental part of the betting shop service." — Mark Kingston, Director, Premier Greyhound Racing. That commercial reality flows to Sunderland, where BAGS fixtures generate the content sustaining that service four times a week.
A practical staking approach should account for three things. First, bankroll allocation weighted toward grades where you have the deepest form knowledge. Second, distance concentration: if your analysis is strongest at 450m, focus there rather than spreading across all four distances. Third, meeting type: Friday evening cards attract different fields and market dynamics from Monday BAGS races.
Do
- Base your Sunderland selections on calculated times and form rather than trap draws — the balanced statistics reward form-focused analysis.
- Track weight changes across consecutive races to identify dogs in improving or declining physical condition.
- Consider forecast and tricast bets, which offer better value at fair tracks where no single trap dominates the market.
Don't
- Apply trap-bias assumptions from other tracks to Sunderland — what works at a biased circuit does not apply here.
- Ignore the grade column when comparing finishing times across different races on the same card.
- Treat Friday evening odds as equivalent to daytime BAGS odds — different market conditions produce different pricing.
History of Sunderland Dogs: 1940 to the ARC Era

Sunderland Greyhound Stadium opened on 23 March 1940, six months into the Second World War, at a construction cost of £60,000. The first winner, Percheron, came home from trap 2 at 5/2 in a time of 28.35 seconds. Wartime crowds were substantial — greyhound racing was one of the few forms of public entertainment that continued to operate under wartime restrictions, and the Wearside mining communities that surrounded the stadium provided a ready audience. The dogs offered an evening out, a few shillings of excitement and a sense of normality in a period that had very little of it.
For the next several decades, Sunderland operated as an independent track within a landscape that featured dozens of greyhound stadiums across the North East. The sport's post-war peak in the late 1940s saw total UK attendance exceeding 50 million per year — a number that makes the modern industry look modest. Sunderland was a solid mid-tier venue, not carrying the prestige of White City in London but generating consistent crowds and competitive racing. Between 1964 and 1974, the stadium shared its facilities with speedway's Sunderland Stars before reverting to single-sport use.
The modern era began with a £1 million refurbishment, led by racehorse owner Terry Robson and former Brough Park trainer Harry Williams, that transformed the facilities from their post-industrial origins into something resembling a contemporary entertainment venue. The rebuild addressed the grandstand, the restaurant and the kennel facilities, bringing the stadium up to the standards required by the sport's evolving regulatory framework. In 1993, Harry Williams became Sunderland's only trainer to win the Scottish Greyhound Derby, guiding New Level to victory — a result that demonstrated the venue could produce top-tier competition.
In 2005, Sunderland received the Northern Greyhound Track of the Year award from the British Greyhound Racing Board, a recognition of both racing quality and facility standards. By this point, the track was operated by William Hill, which had acquired it for £9.4 million in September 2002 as part of a portfolio of greyhound stadiums aligned with the bookmaker's retail betting business.
The most consequential change came in May 2017, when Arena Racing Company purchased Sunderland and Newcastle Greyhound Stadiums from William Hill. William Hill had originally acquired Sunderland for £9.4 million in 2002 and invested in its development across the following decade and a half. ARC's ownership brought Sunderland into a larger commercial structure — the company operates multiple greyhound and horse racing venues — and integrated it into the BAGS and Premier Greyhound Racing fixture systems. The financial reality of the modern sport is stark. In the 2024-25 financial year, the BGRF received £6.75 million in voluntary contributions from bookmakers — a rate of 0.6% of turnover — to fund welfare and prize money across the sport. As Joe Scanlon, Chairman of the BGRF, put it: "This is a very long way from our historic highs, in real terms, of £10m to £14m. Whilst we learn to make every pound work twice as hard we shall nevertheless reach a point where income is simply not enough to match our ambitions." — Joe Scanlon, Chairman, BGRF.
The legislative context adds urgency. The Prohibition of Greyhound Racing (Wales) Bill, introduced in the Senedd on 29 September 2025 and approved at Stage 1 by 36 of 50 members, would ban the sport in Wales between April 2027 and April 2030. While Sunderland is in England and not directly affected, the Wales ban signals a political environment where greyhound racing's social licence is no longer guaranteed. For a stadium that has survived 85 years of wars, downturns and ownership changes, this broader contraction is arguably the most existential challenge yet.
Richard Wales, winner of the 2024 ARC Grand Prix at Sunderland with Farneys Willie, captured the emotional side of the stadium's endurance: "Winning the Grand Prix at Sunderland was the best feeling I've experienced. It was a tremendous moment, one I'll never forget!" — Richard Wales, Grand Prix winner, Sunderland Echo.
Visiting Sunderland: Footfall, Experience and Practicalities
Greyhound racing is an in-person sport in a way that most modern betting products are not. You can bet on Sunderland's races from your phone, but the experience of watching six dogs burst from the traps at the stadium itself is something that data on a screen cannot replicate. Arena Racing Company's own figures suggest this is not a nostalgic observation but a commercial trend: across ARC greyhound venues in 2025, footfall at Newcastle rose 85% on final nights, Dunstall Park saw attendance at PGR Oaks finals increase by 324%, and Nottingham drew over 1,000 spectators on Boxing Day. The direction is upward, and Sunderland is part of that trajectory.
The stadium is located in the Fulwell area, north of Sunderland city centre, accessible by car via the A1018 or by public transport through the Tyne and Wear Metro system (Stadium of Light station is the nearest, approximately a mile south, with bus connections covering the remaining distance). Parking at the stadium is free and accommodates several hundred vehicles, though Friday evening meetings can fill the car park early. Arriving 30 to 45 minutes before the first race on a Friday gives you time to park, collect a racecard and settle into your viewing position.
Admission pricing at Sunderland follows the ARC standard model. General admission covers access to the trackside area and the main grandstand. Restaurant and hospitality packages are available at a higher tier and typically include a two-course or three-course meal served in the stadium's dining area overlooking the track, along with a reserved seat, a racecard and sometimes a betting voucher. These packages are popular for group bookings — birthdays, hen nights, stag dos and corporate outings — and often need to be reserved in advance, particularly for Friday evenings. The official stadium website publishes current pricing and booking details.
The evening itself runs to a predictable rhythm. Gates open, the first race goes off approximately 30 minutes later, and races follow at roughly 15-minute intervals. A full card of 12 races takes around three hours. Between races, you can study form, visit the bar, eat trackside food or watch greyhounds being paraded before the next event. It is a low-pressure environment with no dress code and no expectation that you will bet on every race.
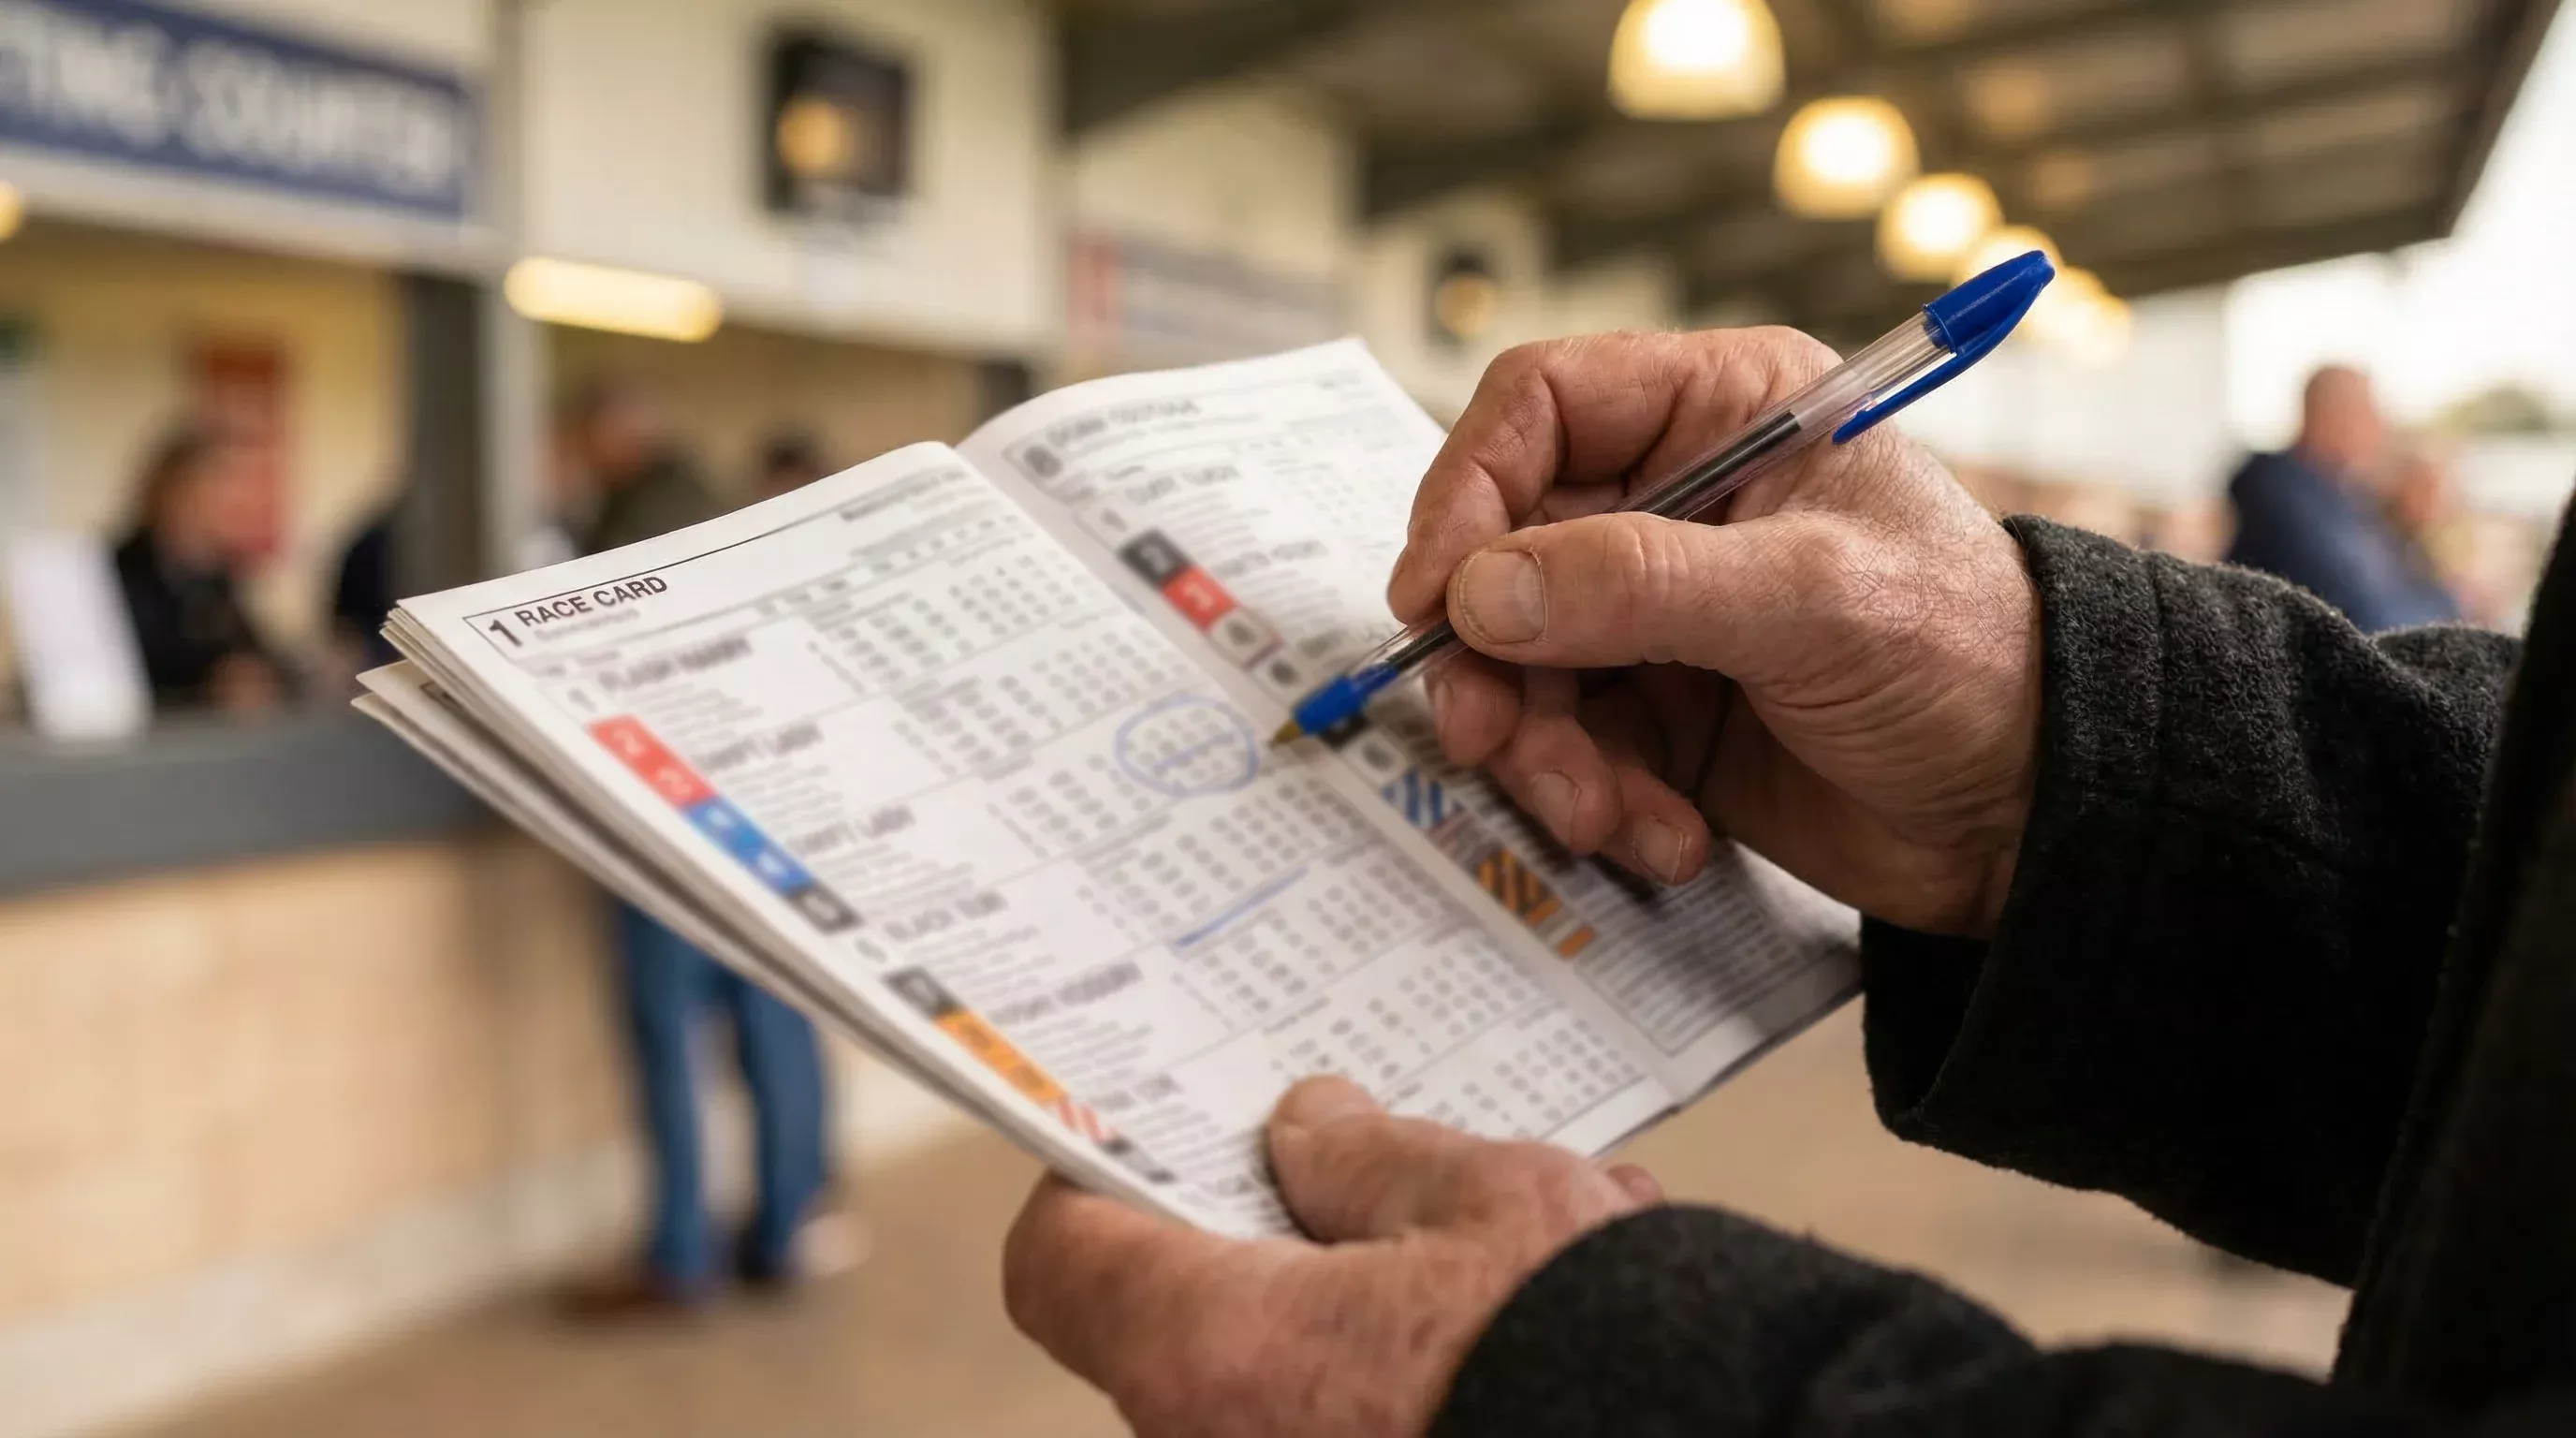
For first-timers, the racecard — available in print or as a downloadable PDF — is essential. It contains trap draws, form figures, grades and trainers for every race. You do not need a bookmaker account to bet at the track; tote windows operate on-course, accepting cash bets on win, forecast and tricast pools. Tipping etiquette is relaxed: there is no obligation, though some regulars leave a pound with kennel hands when their dog wins.
Accessibility provisions include designated parking near the entrance, level access to ground-floor viewing areas and accessible toilet facilities. The stadium is largely single-storey in its public areas, meaning wheelchair users can navigate most of the venue without stairs. Specific accessibility queries should be directed to the stadium before your visit.
Frequently Asked Questions About Sunderland Dogs Results
How quickly are Sunderland greyhound results published after each race?
Results from Sunderland races typically appear within one to two minutes of the finish on the official stadium website and on major bookmaker platforms. SIS — the data feed that supplies results to betting shops — transmits outcomes almost immediately, which means platforms connected to SIS update fastest. Third-party statistics sites such as Greyhound Stats UK may take slightly longer, usually within 10 to 15 minutes, because they aggregate and verify data before publishing. If you are checking Sunderland dogs results tonight during a live meeting, the bookmaker apps you already use for betting will generally be the quickest source, followed by the official Sunderland Greyhound Stadium website. For historical results beyond the current meeting, Greyhound Stats UK and the GBGB's own data archives provide searchable records going back several seasons, including sectional times, calculated times and full race comments.
Why is Sunderland considered one of the fairest greyhound tracks in the UK?
The fairness reputation comes directly from the trap statistics. Over sustained sample periods, each of the six traps at Sunderland wins approximately 17% of races, which is remarkably close to the 16.67% that a perfectly balanced track would produce. By contrast, many UK tracks show Trap 1 winning 18-19% or more due to the inside-rail advantage through the first bend. Sunderland's combination of an Outside McGee hare, well-cambered bends and consistent all-weather sand surface produces conditions where no starting position offers a persistent structural edge. For bettors, this means that form, fitness and pace profile are the dominant factors in race outcomes rather than the box draw — a characteristic that rewards analytical approaches and makes the track unusually appealing for data-driven punters.
What distances are available at Sunderland and which one produces the most results data?
Sunderland races over four distances: 261m (sprint), 450m (standard), 640m (stayers) and 828m (marathon). The 450m standard distance produces the overwhelming majority of results data because it is used for most graded races and virtually all BAGS fixtures. If you are building a form database or tracking trends at Sunderland, the 450m results will give you the largest and most statistically reliable sample. The 261m sprint and 640m stayers distance feature regularly but less frequently, while 828m marathon races appear only occasionally — typically as specialist events on feature cards. Each distance demands different qualities from the runners, so form at one distance does not transfer automatically to another. A dog's sprint form at 261m tells you about its trap speed and early acceleration; its 640m form reveals stamina and tactical racing ability. They are effectively different sports run on the same piece of sand.